Before Marcott et al (2013) published their synthesis of over 70 Holocene palaeoclimate reconstructions, I didn’t have a strong expectation of how global annual mean temperature should vary over the Holocene, except that changes would be small relative to glacial-interglacial changes. Marcott et al found a warm early Holocene followed by a gradual cooling in the mid and late Holocene. This is a pattern found in many reconstructions from summer-sensitive proxies from northern high latitudes where it mirrors the Holocene trend in summer insolation.
It might seem curious that global annual mean temperatures should follow the seasonal response in one region, but the northern high latitudes have strong positive feedbacks to insolation changes. For example, as summer insolation declines, summers are no longer warm enough to melt all the snow that accumulated in the previous winter, increasing the albedo and leading to further cooling. Such processes are important on glacial-interglacial time scales, so perhaps also in the Holocene.
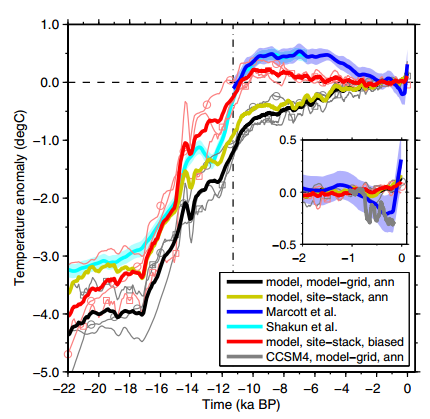
Liu et al (2014) challenged Marcott et al’s reconstruction, showing that three climate models predicted rising temperatures throughout the Holocene. Liu et al argue that seasonal biases in the reconstructions used by Marcott et al could account for the discrepancy between the proxy data and models.

Liu et al Fig 1. Global surface temperature over the last 22 ka: reconstructions of Marcott et al (blue) after 11.3 ka and by Shakun et al. (cyan) before 6.5 ka, model annual mean temperature averaged over the global grid points (black), and model seasonally biased temperature averaged over the proxy sites (red). Models are CCSM3, FAMOUS (□) , and LOVECLIM (○), with the ensemble mean shown by heavy lines and individual members shown by thin lines. Temperature curves are aligned at 1 ka. The ensemble mean model annual temperature averaged over proxy sites is also shown (yellow), whose similarity to the model grid average demonstrates the insensitivity of the temperature trend to the average scheme.
In my previous post, I showed how seasonal biases in proxies can occur. In this post, I am going to think more about the Holocene conundrum.
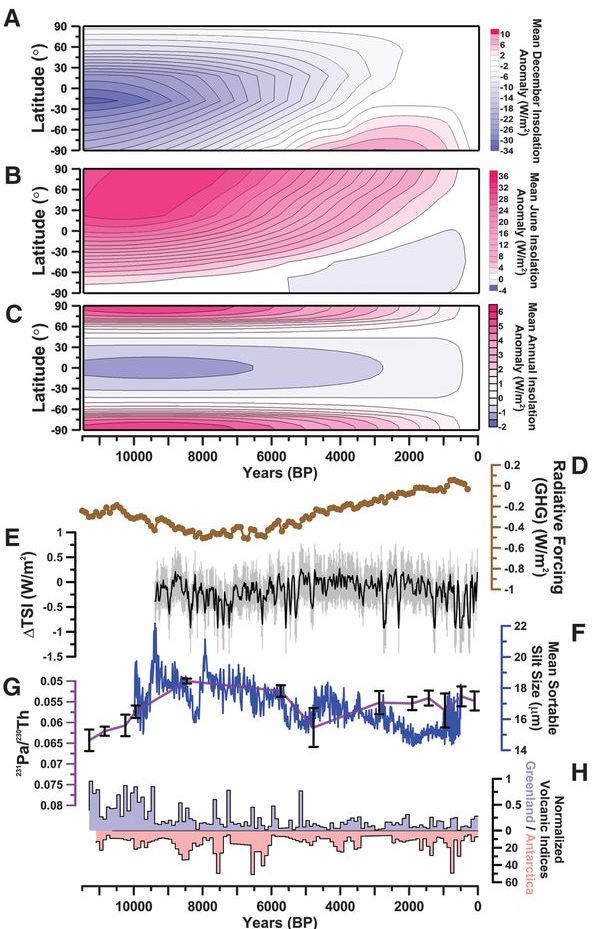
Some of the major forcings are shown in figure 2 from Marcott et al.

Figure 2 Holocene climate forcings and paleoclimate records. Contour plots of (A) December, (B) June, and (C) annual mean latitudinal insolation anomalies relative to present for the past 11,500 years. (D) Calculated radiative forcing derived from ice-core greenhouse gases (GHG) (CO2 + N2O + CH4). (E) Total solar irradiance anomalies (ΔTSI) relative to 1944–1988 CE derived from cosmogenic isotopes. (F and G) Proxies for the strength of the Atlantic meridional overturning circulation. (H) Volcanic sulfate flux (in kg/km2) from Antarctica and volcanic sulphate concentration (in parts per billion) from Greenland in 100-year bins. Both records are normalized relative to the Krakatoa eruption.
The seasonal and latitudinal distribution of insolation changed over the Holocene due to changes in the Earth’s orbit, but the total amount varied little. Liu et al show that climate models are insensitive to this orbital forcing using both their three models (CCSM3, LOVECLIM and FAMOUS) and 29 models in the PMIP3 mid-Holocene vs pre-industrial runs (mean response 0.1 °C warming since the mid-Holocene).
Greenhouse gases, measured in ice cores, decline in the early Holocene and then increase after 6 kyr BP. Ruddiman (2003) suggested that this increase represented an early Anthropocene contribution to greenhouse gases, as previous interglacials had a monotonic decline in greenhouse gases. More recent work suggests that the trends in greenhouses gases can be explained by natural processes. The increase in radiative forcing from greenhouse gases should yield a warming of ~0.4°C (depending on climate sensitivity).
Solar variability during the Holocene shows high frequency variability but little trend. Volcanic forcing is uncertain but is stable or decreasing through the Holocene (volcanic activity may have been higher at the start of the Holocene in the previously glaciated regions because of unburdening of the magma chambers when the ice melted).
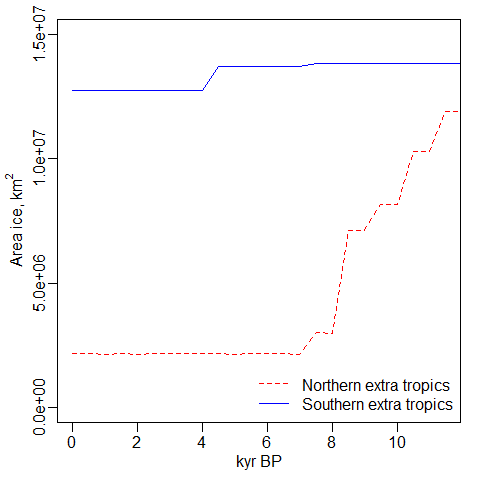
The waning of the large ice sheets in the early Holocene would have reduced albedo (causing warming) and changed circulation patterns. The ice sheets since the last glacial maximum have been reconstructed by Peltier (2004) based on post-glacial isostatic adjustment and other data. There is an animation here.

Figure 3. Holocene ice area. Data from ICE -5g (Peltier 2004). Apologies, the time axis is the reverse of the previous two figures.
I’ve extracted the area of ice from the 1° x 1° resolution ncdf files. For reference, the area of Canada is 107 km2. The ice sheets that covered large parts of North America and Europe melted during the early Holocene, before 7 kyr BP. The well known re-advance of ice in the late Holocene in Norway and the Alps is very small compared to the ice lost in the early Holocene.
Meltwater from the ice sheets will have cooled the early Holocene climate, for example, the 8.2 ka event.
To summarise, changes in ice-sheet albedo, meltwater flux and greenhouse gases will all have acted to make the late Holocene warm relative to the early Holocene. Set against this is the orbital forcing that should give high-latitude warm summers in the early Holocene, but no annual forcing. It would appear difficult to reconcile Marcott et al’s cooling Holocene temperature trends with these forcings. However, I’m not yet convinced. It is possible that feedbacks from the orbital forcing could lead to annual warming from a summer only forcing.
I’m thinking particularly of vegetation climate feedbacks. Two examples:
- During the early Holocene, forests approached the Arctic Ocean in Siberia under the influence of warmer summers. Forests have now retreated 200-300 km south, and have been replaced by tundra with a higher albedo.
- During the early Holocene, the Sahara was an area of lakes, grasslands and savannah. In the late Holocene, this lush landscape was replaced by desert which has a higher albedo. The desert is also a source of dust which has a cooling effect on climate.
Two of the models used by Liu et al, CCSM3 and LOVECLIM, have a dynamic vegetation module and should in principle be able to recreate these shifts in vegetation and their climate impacts. FAMOUS, a speeded up version of HADCM3, does not. It is not clear without digging how many of the 29 PMIP3 models have dynamic vegetation. Those that don’t were instructed to use pre-industrial vegetation, and so will miss vegetation-climate feedbacks, biasing the mid-Holocene – pre-industrial contrast.
I don’t think any of the PMIP3 model have an interactive dust component.
I would be more confident of Liu et al’s Holocene trends if I knew that the behaviour of vegetation in the model was a good match for what is known about Holocene vegetation trends. I’d also like to see if the PMIP3 models with a dynamic vegetation model have a different response to orbital forcing than those that don’t.
I agree with Liu et al that Marcott et al’s reconstruction of global annual mean temperatures may be biased because of the seasonal biases in proxy sensitivity, but I’m not yet ready to accept Liu et al’s progressively warming Holocene as I don’t see many reconstructions with that shape.
We need to better understand the seasonal biases and limitations of proxies to make better syntheses. We also need independent data. I think the Holocene sea-level curve could help determine whether the proxy data or the climate models are closer to reality.
Sea levels rose by 2-3 m between 7 and 3 ky BP. (IPCC AR5 2013). About 10% of the rise can be attributed to mid-late Holocene melting on west Antarctica, the rest is presumably from thermal expansion, either due to a warming climate, or a long lag between warming at the start of the Holocene and the deep oceans re-equilibrating. Since 3 ky BP, sea levels have fluctuated only slightly, which does not appear to be consistent with either reconstruction.
I predict there are going to be several papers over the next year or so trying to solve this Holocene conundrum.

 @richardjtelford
Great post, I really like the insightful observations on orbital forcing and the SLR part.
I also wonder how the deep and abyssal ocean was initialized (and then how it evolved to present day) in the model ensembles used by Liu.
Thanks. The deep ocean is one of aspects of Liu’s models that I would like to see explored.
The trajectories of the model runs put me in mind of Figure 12 in Ganopolski et al. 2010. They performed a sensitivity test for timestep length when simulating over glacial-interglacial timescales and found that deep oceans warmed at a considerably lower rate when the simulation was accelerated. This in turn seemed to affect the rate at which surface temperatures could change (essentially the speed at which they moved towards equilibrium), resulting in continuation of glacial->interglacial warming over the Holocene, whereas in the unaccelerated case such warming was mostly done by about 8kyr BP.
Liu et al. 2014 mentions that the FAMOUS model run was accelerated, but nothing about the others. Given the integration timescale of 20kyr+ I find it difficult to believe the other models weren’t sped up in some way, particularly since all model runs seem to follow a similar trajectory. I can’t see any discussion of this potential issue in the paper.
My interpretation was that LOVECLIM and CCSM3 were not accelerated. LOVECLIM is fast – “On one single Xeon processor (2.5 Ghz), it is possible to run 100 years, with all the components activated, in about 4 h of CPU time” – so the analysis could be run in just over a month. I guess CCSM3 also sit at the fast end of the fast vs complex models.
What the deep oceans and vegetation are doing are key to this analysis. Only if these components are following the observed Holocene trajectories, can the surface temperatures be relied upon.
Hi,
I’m a complete layman when it comes to this. In summary, the Holocene seemingly cooled from originally having high temperatures like we have today? And the reasons for this are feedback loops such as the ice-albedo, which speed up cooling? There was an article last year in nature talking about the possibility of removing atmospheric dust from the models which changes the trend, I was wondering what you thought about this!
(I understand this was written a while back but it still seems relevant)!
Jonathan