Richard Telford’s Blog
 @richardjtelford
Recent Comments
-
Recent Posts
- Resampling Assemblage Counts
- A demo targets plan for reproducible pipelines for Neotoma data
- Reproducibility of high resolution reconstruction – one year on
- Simplistic and Dangerous Models
- COVID-19, climate and the plague of preprints
- Erroneous information … was given
- Making a pollen diagram from Neotoma
Archives
Categories
Tags
- analogue quality
- autocorrelation
- Baffin Island
- Barycentre
- Benthic foraminifera
- Bob Irvine
- Bulafu et al (2013)
- calibration-in-time
- China
- chironomids
- chrysophytes
- climate models
- critical transition
- data archiving
- diatoms
- Dietl (2016)
- dinocysts
- Doug Keenan
- EDA
- graphics
- Guiot and de Vernal (2011)
- h-block cross-validation
- Heartland
- impact
- INTIMATE training school
- Kelsey et al 2015
- Klein et al (2013)
- Klemm et al 2013
- lake level
- Lake Silvaplana
- Larocque-Tobler et al (2010)
- Larocque-Tobler et al (2011)
- Larocque-Tobler et al (2012)
- Larocque-Tobler et al (2015)
- LGM
- Liu et al 2014
- Lyons et al 2016
- maps
- Marcott et al 2013
- Mauri et al (2015)
- Miller et al 2013
- moss
- Murry Salby
- neotoma
- NIPCC
- Norway
- ocean acidification
- ordination
- palaeoSig
- Peer review
- Planktonic foraminifera
- Poland
- pollen
- R
- radiocarbon calibration
- radiocarbon dating
- Reconstruction diagnostics
- reconstructions
- REDFIT
- Schulz & Mudelsee (2002)
- Sea ice
- sea ice reconstruction
- Skjærvø et al (2015)
- spatial autocorrelation
- Spectral analysis
- Tatra Mountains
- Telford (2006)
- Telford and Birks (2011)
- Testate amoeba
- Transfer function diagnostics
- Uganda
- uneven sampling
- Willie Soon
- Younger Dryas
- Zhang et al 2017
Blogroll
Follow me on Twitter
My TweetsMeta
- Follow Musings on Quantitative Palaeoecology on WordPress.com
Category Archives: Uncategorized
Simplistic and Dangerous Models
A few weeks ago there were none. Three weeks ago, with an entirely inadequate search strategy, ten cases were found. Last Saturday there were 43! With three inaccurate data points, there is enough information to fit an exponential curve: the prevalence … Continue reading
COVID-19, climate and the plague of preprints
Many diseases have geographically variability in prevalence or seasonal variability in epidemics, which may, directly or indirectly, be causally related to climate. Unfortunately, the nature of the relationship with climate is not always clear. With the recent outbreak of COVID-19, … Continue reading
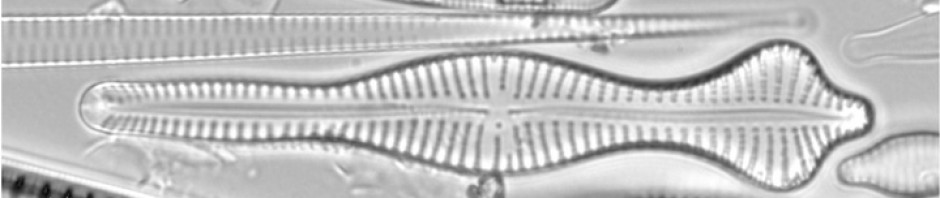
Double diatoms
I am in awe of Dr Elisabeth Bik and her amazing ability and dedication to spotting duplications in images. A new thread on – what appears to be – an obviously photoshopped image by Andrzej N released by @NatGeoMagI guess … Continue reading
Posted in Peer reviewed literature, Uncategorized
Tagged diatoms, Witak et al. (2017)
Leave a comment
Funky ordination plots with ggvegan
Yesterday, I tweeted a photo of a ordination I plotted with ggvegan, and thought I should show how I made it. ggvegan and ggplot make it easy to make complex ordination plots pic.twitter.com/zmEal7W4Q8 — Richard Telford (@richardjtelford) April 10, 2019 … Continue reading
Sunspots and raindrops
It is time, as the walrus said, to talk about another paper reporting an effect of solar variability on the Earth’s climate. Laurenz et al. (2019) correlate European country-scale precipitation data from CRU with the number of sunspots, a proxy … Continue reading
The elevation of Lake Tilo
For my PhD, I studied the palaeolimnology of two lakes in the Ethiopian rift valley, using diatoms to reconstruct changes in the water chemistry of Lake Awassa, an oligosaline caldera lake which retains its low salinity despite having no effluent … Continue reading
Posted in Data manipulation, Palaeohydrology, R, Uncategorized
Tagged lake level, Lake Tilo, Telford and Lamb (1999)
Leave a comment
Bergen: a year with some sunshine
May was glorious. December less so. The data are from the Geofysisk Institutt in Bergen. Here is the code I used
Statigraphic diagrams with ggplot
rioja::strat.plot is a great tool for plotting stratigraphic plots in R, but sometimes it is not obvious how to do something I want, perhaps a summary panel showing the percent trees/shrubs/herbs. Of course, I could extend strat.plot, but I do … Continue reading
Package version control
One aspect of writing a manuscript that I find tedious is checking the versions of the R packages I used. So I wrote a small function to do this automatically. (I don’t use = as an assignment operator in my … Continue reading
Posted in R, Uncategorized
Leave a comment
Been scooped? A discussion on data stewardship
At Climate of the Past, there is a pre-print by Darrell Kaufman and others on the data stewardship policies adopted by the PAGES 2k special issue. Abstract. Data stewardship is an essential element of the publication process. Knowing how … Continue reading
