Last year, Marcott et al (2013) published a synthesis of Holocene proxy temperature records showing a warm early Holocene followed by a slight cooling in the mid and late Holocene. Liu et al, in a paper to be published in PNAS, challenge this reconstruction, showing climate model runs that show a progressive warming throughout the Holocene as ice sheets melted and greenhouse gasses increased. Liu et al argue that part of the divergence is due to seasonal biases in the proxies used by Marcott et al and show that the global Holocene trend in Marcott et al can be recreated by averaging the temperature at each proxy location using seasonal temperature that each proxy is sensitive to rather than the annual mean.

Liu et al Fig 1. Global surface temperature over the last 22 ka:
reconstructions of Marcott et al (blue) after 11.3 ka and by Shakun et al. (cyan) before 6.5 ka, model annual mean temperature averaged over the global grid points (black), and model seasonally biased temperature averaged over the proxy sites (red). Models are CCSM3, FAMOUS (□) , and LOVECLIM (○), with the ensemble mean shown by heavy lines and individual members shown by thin lines. Temperature curves are aligned at 1 ka. The ensemble mean model annual temperature averaged over proxy sites is also shown (yellow), whose similarity to the model grid average demonstrates the insensitivity of the temperature trend to the average scheme.
When Marcott et al was published, it got a lot of attention. Tamino showed that the uptick at the end of the record was due to proxy-dropout (not all proxies records continue till the end of the reconstruction). Steven McIntyre made a lot of noise about essentially irrelevant problems with the age-depth models used by Marcott et al (they had had to make new age-depth models for their Monte Carlo methods and had made the assumption that the top of the core was 1950 unless otherwise stated. This is a commonly used assumption, but is not always appropriate). McIntyre’s concerns about 20th Century patterns in the alkenone records used in Marcott et al are more interesting.
I spent so much time discussing the trivial issues about the age-depth models, I had no energy for considering other potential problems with Marcott et al. The seasonality of the proxies is an obvious candidate, and which Marcott et al give due consideration. In this post, I’m going to first show how these seasonal biases in proxies can occur and then examine how Marcott et al investigated this potential problem.
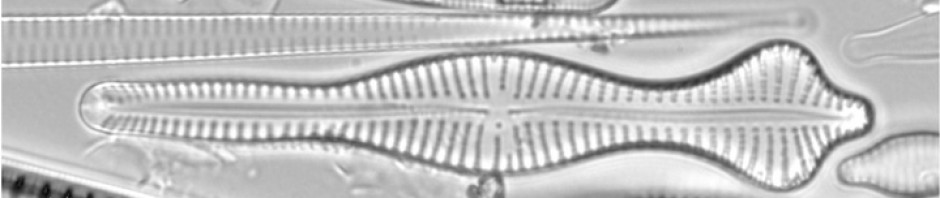
Many temperature sensitive palaeoceanographic proxies have been used in the Norwegian Sea: diatoms, foraminifera and radiolarian assemblages, alkenones (biomarkers from coccolithophorids), and trace element and isotope geochemistry of planktonic foraminifera. All these proxies are predominantly produced in the spring-summer months as there is very little biological production during the cold dark winter, so we might expect all of the proxies to record a common signal. However, the different reconstructions are very different, as shown by Andersson et al 2010.

Fig. 6. (A) Mean July temperature based on pollen from Tsuolbmajavri, Finland (Seppa and Birks, 2001). Other proxies are from core MD952-11 from the Vøring Plateau (B) Alkenone derived sea-surface temperatures (Calvo et al., 2002; Jansen et al., 2008). (C) Diatom-based sea-surface August temperature estimates (Birks et al., 2002). (D) Foraminiferal-based transfer function sea-surface temperature estimates for summer (JAS) (Andersson et al., 2003; Risebrobakken et al., 2003). (E) Radiolarian-based transfer function sea-surface summer temperature estimates (Dolven et al., 2002). The alkenone and radiolarian reconstructions are included in Marcott et al.
The diatom and alkenone (U37k) reconstructions resemble one another, and share the downward trend since the Holocene thermal maximum with pollen-inferred summer temperature and the decline in summer insolation at these high latitudes as the Earth’s orbit changed. The foraminifera and radiolarian transfer function-based reconstructions have weak but opposing trends to the diatoms and alkenones. Not shown here are the isotope and trace element analyses on the foraminifera that share the same trend as the foraminiferal assemblages.
The critical difference between the proxies reconstructing a declining Holocene temperature and those reconstructing an increasing temperature is the depth habitat of the organisms. Diatoms and the coccolithophorids that produce alkenones are photosynthetic. They are constrained to live in the photic zone, the upper 50m of the water column where there is sufficient light. The foraminifera and radiolaria live over a range of depths. The dominant foraminifera in this area live between about 75 and 250 m.
The depth habitat of the organisms is important because of the seasonal pattern of stratification in the Norwegian Sea. All the organisms are living within the current of warm Atlantic water that flows into the Nordic Seas. In summer, the surface layers of this water mass absorb sunlight and become warmer and less dense, separated from the subsurface water by a thermocline. Consequently the subsurface warms little in summer. In autumn, the surface cools and stormy weather force mixing over the winter months. The temperature of the surface in winter sets the temperature in the subsurface year round. So although all the organisms are growing in summer, the temperature of the water they are living in is set by either the summer or winter.
Over the Holocene, the amount of summer insolation declined, summers became cooler, and this is reflected by the surface proxies. Winter insolation increases slightly over the Holocene. Hence we would not expect surface and subsurface proxies to show the same trends in this region. In other regions the seasonal biases attached to proxies may differ.
Marcott et al were well aware of the potential problems with seasonality and discuss it in the supplementary material. They examine the difference between alike and unalike proxies from the same 5° grid cells and find no difference in the mean difference, so assume that “that if a seasonal bias exists between proxies, it adds no more uncertainty than that associated with proxy-temperature calibrations.” This is optimistic. First, that any bias is no larger than the variance does not imply that the result will be unbiased. Second, the test is weak as unalike proxies may be sensitive sensitive to the same season, so the number of genuine contrasts may be smaller than it appears.
Marcott et al also run an analysis akin to that in Liu et al, comparing climate model output averaged across the core sites for the annual mean temperature and the seasonal temperatures that the proxies are most sensitive to. The result is surprisingly similar to that obtained by Liu et al – the temperature increases throughout the Holocene – but the difference between the two analyses is smaller, so Marcott et al argue that with the inclusion of proxies with different seasonal biases, the biases have cancelled out.
The final test is to re-make the global Holocene reconstruction with just the proxies defined as annual proxies by the original authors. Here the reconstruction shows the same trend, but with a higher amplitude than the inclusive reconstruction, the opposite of what is expected if seasonal biases are important. This analysis depends on the original authors assignment being correct – some are dubious.
That the seasonality (and perhaps other factors) have proved to be a problem for Marcott et al does not surprise me greatly. Earlier this year I discussed Hessler et al who found that proxies from the mid-Holocene were difficult to reconcile with each other and with models. I warned that if this result was correct, Marcott et al’s reconstruction would be questionable.
Liu et al is certainly not the last word. Even though they show that by accounting for seasonal biases in the proxies the global mean temperature trends in the model and proxies can be reconciled, the correlation between the trends in the model and individual proxies is near zero. Part of the problem may be the depth assignment of proxies – all reconstructions are assumed by Liu et al to be surface reconstructions. I showed above that depth matters, different Holocene temperature trends can occur at the same locality at different depths.
 @richardjtelford

Richard, I’m glad that you’ve commented on the alkenone issue.
In your comments above, I think that you’ve indulged in both some inaccuracy and some unfair sniping against me. I wrote a post diagnosing Marcott’s uptick to proxy dropout (see http://climateaudit.org/2013/03/15/how-marcottian-upticks-arise/) a week before the Tamino post that you credit with this observation (see http://tamino.wordpress.com/2013/03/22/the-tick/). When Tamino was subsequently challenged on not citing my prior post, he admitted that he had consulted my article and had even linked to it in a draft version, but decided that he didn’t like me and that this justified him in not citing my prior diagnosis.
ALthough you snipe at the relevance of Marcott’s re-dating, because the population of proxies in the uptick period was so miniscule, individual re-dating decisions had a material impact on the amount of uptick. Nor do I agree with your suggestion that the re-dating was a necessary component of using a consistent CALIB version – the coretop redating was a separate step in the methodology.
Marcott’s short-period centering in the mid-Holocene also exacerbated the proxy dropout problem especially in his SXT zonal reconstruction, where a single quirky diatom MAT series (TN057-17) reaches 4 sigma values in the 20th century and makes an increasing contribution as other proxies drop out. It also results in the SXT uptick commencing in the 15th century and reaching very high values around 1900 AD – results that are inconsistent with all other data in the region, but which do not seem to have been adequately challenged by specialists.
Anyway, back to alkenones. It seems plausible that northern alkenones are primarily a function of summer temperatures and that this is what is shown in the NXT alkenone series. But over the Holocene, it seems to me that Vinther’s Renland and Agassiz d18O series have generically similar shapes to the alkenone series? On your reading, how is this reconciled?
My discussion of the blog posts on Marcott et al was not meant as a comprehensive review, but describes my personal recollection. Having read both posts on the uptick today, I find Tamino’s clearer and more constructive.
The uptick is obviously not robust – the mimumum sampling resolution of 300 years, only a few proxies remain in the uptick. It should never have been included in the paper. As the dating issues only make large differences to the uptick, not the main Holocene trends that are central to the paper, prolonged discussion of the dating was a distraction from potentially more interesting aspects of the paper. The change of calibration curve from Marine04 to Marine09 will have made minimal difference to Marcott et al (much more to Shakun et al). For the earlier cores dated with the marine INTCAL98 curve, the difference would have been larger, but probably not interesting. Marcott et al wanted to incorporate chronological uncertainty into their analysis. They should be praised for this – many people ignore this problem. So they needed an estimate of the chronological uncertainty at each depth in the core. Uncertainty estimates on the would not be available for many of the cores, and where available would often be an underestimate (see Telford et al 2004), so they would have to re-make the age-depth models for each core. This required a decision about the age at the top of the core. They could certainly have done it better, but since this decision has no bearing on the main thrust of the paper, I am not surprised that they did not think more about this step.
The ice-core d18O series will presumably depend on the seasonality of precipitation. I would expect the mean annual temperature at this latitude to decline over the Holocene – with a large decline in summer and little change in winter.
Richard, imagine what some people would say if they had removed the uptick!
Richard, very interesting, thanks. I had some trouble – being a lowly physicist – understanding the biases discussed in Lui et al. Much clearer now.
Very interesting and informative post!
I just think it misses one or two points that might help people to get a better idea here.
One is the deep and abyssal ocean (as in below 700m and 2000m respectively), where more than 90-95% of the long-term heat is going. In that regard the trends shown by the models are correct, over the total Earth energy there was a continuous warming-up probably to around LIA. And confirmation for that comes not only from the proxies already discusses, but IMHO more important from the sea level.
The other point is regarding the complexity of the task that models have to solve here, most people don’t fully realize the difficulty of running a model for 10-20kyr and tend to underestimate the importance of getting the deep ocean right. And as England 2014 (http://www.nature.com/nclimate/journal/v4/n3/full/nclimate2106.html) has shown that kind of details are not always perfectly resolved by current models, so I believe Liu 2014 are probably falling into the same mini-trap here.
But of course the subject is far from being elucidated.
Catalin,
Your comment about sea level rise doesn’t quite seem consistent with what Rob Painting suggests. I must admit that I’m slightly confused now, as I had thought that there was a general rise in sea level over the course of the Holocene.
This is the usual picture of Holocene sea-level change which is consistent with ice-melt dominating until ~8ka and then warming of the ocean for several thousand years after that. If the Holocene warming occurs at depth, that could be consistent with either a warming or cooling trend at the surface, because of the lags involved – the time to ventilate the deep ocean is up to 5000 years. So deep waters formed in the cold last glaciation will have hung around until the mid-Holocene
Richard,
Thanks. That’s the image I’d also found. I agree that deep ocean warming could be consistent with surface cooling or warming, but the figure doesn’t seem, though, consistent with what Rob Painting was suggesting. He seemed to suggest that there was evidence for cooling from the early Holocene to the Industrial Revolution.
There are examples of late Holocene emergence, but I don’t think they are widespread and may reflect local land uplift. I’ve just found Rob’s page on sea level change. Not sure I would trust Hawaii for sea-level reconstructions! Although I have published on sea-level changes (with Andrew Kemp), I am not familiar with the literature Rob cites.
I think section 5.6.3 in AR5 WG1 paints a more relevant picture – “Ocean volume between about 7 ka and 3 ka is likely to have increased by an equivalent sea level rise of 2 to 3 m” (10% from ice, much of the rest probably thermosteric). Also section 13.2.1.4 has some similar information.
Richard – the equatorial oceans are littered with evidence of a Holocene sea level highstand, not just Hawaii – although that was the clearest example I could find for communication purposes. Search “Holocene sea level highstand” in Google Scholar and you’ll find dozen of published papers covering the Indian Ocean, Pacific, and the Atlantic.
There are also numerous papers examining the fall in ‘relative’ sea level around Australia, and
even deniers like Joanne Codling cite some of this research (Australian sea levels have been falling for 7000 years), but don’t understand its implications.
The Mitrovica and Milne paper explains ocean siphoning due to the collapse of glacial forebulges and continental levering, and Richard Peltier has shown that (according to his GIA models) the ocean volume was most likely static over the last 4-5000 years. If it were otherwise we wouldn’t have coral atolls for example, as those solid reef structures formed when sea level was higher and were exposed as sea level fell throughout the late Holocene. This also fits with archaeological evidence of the timing of colonization of Pacific atolls.
So no, this is not just some isolated effect related to local subsidence or uplift – this is a globally coherent phenomenon and there is a plausible physical explanation for these observations.
From the AR5 chapter 13, “RSL records indicate that from ~7 to 3 ka, GMSL likely rose 2 to 3 m to near present-day levels (Chapter 5). Based on local sea level records spanning the last 2000 years, there is medium confidence that fluctuations in GMSL during this interval have not exceeded ~ ±0.25 m on time scales of a few hundred years.”
It is not immediately obvious how to reconcile this recent stability with either Marcott’s cooling or Liu’s warming trend. Given the potential lags between climate change and the final sea-level response, my inclination is towards cooling. Would certainly be interesting to see a modelled sea-level from Liu et al and compare it with the reconstructions.
Yes , and when one actually reads AR5 Chapter 5 – the chapter referenced by chapter 13 one finds the following:
“For the Holocene, the emphasis is on the last 6000 years when ice volumes stabilized near present-day values, providing the baseline for discussion of anthropogenic contributions.”
and:
“There is high confidence that minima in NH extratropical glacier extent between 8000 and 6000 years ago were primarily due to high summer insolation (orbital forcing)”
Seems like IPCC needs to revise their summary of the work referenced in those chapters because they aren’t making much sense.
Manual pingback:
> The Marcott dataset is dominated by alkenone series, which are also responsive to summer temperatures and should therefore be interpreted as a reconstruction of summer temperatures, rather than annual temperatures – see useful discussion by Richard Telford here here other than his pointless snipe at me about criticizing the fake Marcott uptick )
http://climateaudit.org/2015/01/08/ground-truthing-marcott/