“And some things that should not have been forgotten were lost. History became legend. Legend became myth. And for two and a half thousand years, the metadata passed out of all knowledge.”

Michener et al 1997 Figure 1. Example of the normal degradation in information content associated with data and metadata over time (“information entropy”). Accidents or changes in storage technology (dashed line) may eliminate access to remaining raw data and metadata at any time
A couple of months ago, Eric Grimm gave an introduction to the Neotoma database in Bergen for participants in the HOPE project (PhD and postdoc positions to be advertised soon).
I started to tinker with the neotoma R package and downloaded some fossil pollen data. Actually, all the pollen data: over 2700 sites; 110 thousand levels; and 120 million terrestrial spores and pollen grains.
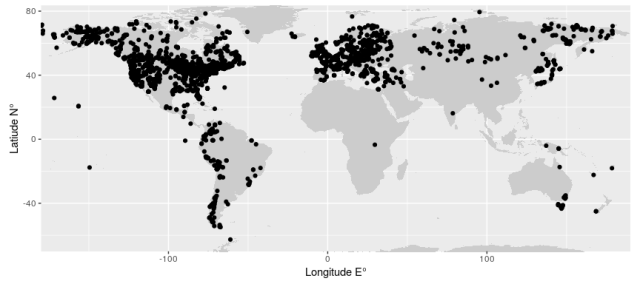
Location of Neotoma fossil pollen data sets
But what to do with 170 MB of data?
The first thing I do with any data-set is to test it for oddities: improbably values or patterns that might indicate errors or misunderstandings. I developed a set of methods last year to test the ever-so curious chironomid data from Lake Żabińskie: I’m looking forward to applying them to this huge amount of pollen data.
Expections 1: counts should be integers
The vast majority of the pollen data in Neotoma is labelled as being count data – I’ve omitted a small amount labelled as percent data. Counts should be integers, so any non-integers values would be cause for concern except that pollen analysts often count half grains of Pinus and some other conifers (some Tsuga, Podocarpus, Pinaceae) with pollen which often splits into two identifiable parts (half counts are also common in diatom and chironomid counts). So I am expecting integer and half values for some conifer species but that is not what I found.
The vast majority of counts are integer (or half) values; only 7537 (0.3%) are not.
Of these, 3923 are near integer (or half) values (absolute difference less than 0.001). These are probably because some of the count data have been back-calculated from percent data (or read off pollen diagrams) and there are rounding errors. These errors are inconsequential and are trivial to fix.
The counts for Pinaceae were more variable that I had imagined. While the vast majority of counts are integers (309096) or half values (11104), 374 counts appear to be tenths, quarters, or thirds of a grain with a few odd values that might be percent – see below.
I also discovered that some analysts count Acer grains in thirds.
Excluding the conifers and Acer which have non-integer counts, there are still several thousand non-integer counts in the database. These may represent typos, which should be sporadic, or indicate that the data are not counts, but are instead percent or pollen concentration/influx data, which might have pervasive non-integer values. It is also possible that some analysts count half grains of a broader range of taxa, in which case the non-integers should be restricted to a few taxa.
Eighty four data sets have at least one unexpected non-integer value; 37 have more than five. These are the 5 data sets with more than half the counts non-integer values.
| .id | Proportion | Number |
|---|---|---|
| 15059 | 0.99 | 1806 |
| 16209 | 0.91 | 524 |
| 16210 | 0.83 | 171 |
| 15696 | 0.73 | 517 |
| 16090 | 0.59 | 237 |
We can examine these data sets with the browse function.
browse(16090)
browse(15696)
browse(15059)
browse(16209)
browse(16210)
The very high numbers in 16090 suggest that these are influx or concentration data – one would need to check the original publication. The others look more like percent data, but need to check as the values sum to more that 100 in each sample for all but 15059. I’m going to drop these data sets from the remainder of my analysis.
The other samples with non-integer values mostly have half integers. These could be from calculating percent from a count sum of 200, or even more enthusiastic counting of half pollen grains. The remaining values look like errors of one kind or another.
It should be relatively easy to flag data with unexpected non-integer, but I’m going to ignore these for now and for simplicity round all fractional values up.
Expectation 2: Count sums should be reasonable
Many palynologists count three hundred or five hundred pollen grains per sample. I don’t think anyone ever counted twenty thousand grains per sample. It would just take too long.
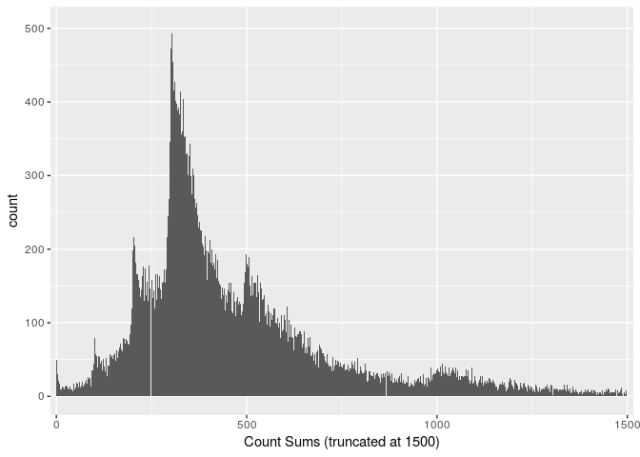
The white lines at ~250 and ~850 are plotting artefacts
Very high counts might indicate that influx/accumulation rates have been entered instead of counts. Alternatively, some palanyologists might be really enthusiastic, or, in low diversity samples, the abundance of the dominant taxon might be estimated which could lead to high counts without high effort.
The data reports counts as high as 25241. I’m going to arbitrarily set 5000 as my threshold for concern. This flags 0.1% of the samples. These are some of the 36 data sets with count sums over 5000.
| .id | Proportion | Number | Minimum | Median | Maximum |
|---|---|---|---|---|---|
| 4404 | 0.01 | 2 | 29 | 528 | 25241 |
| 488 | 0.23 | 9 | 572 | 2500 | 19062 |
| 4355 | 1.00 | 23 | 11626 | 11876 | 12072 |
| 16091 | 0.03 | 2 | 418 | 590 | 10838 |
| 3568 | 0.41 | 7 | 490 | 3766 | 10641 |
| 294 | 0.13 | 5 | 1095 | 2687 | 10481 |
Some of these are probably easy to explain. 4355 is either in the middle of the densest stand of Lycopodium since the Carboniferous, or the Lycopodium spike has been mis-labelled. Likewise, the Eucalyptus count suggests that 4095 (Hockham Mere) is a portal to the Antipodes.
Others appear to be typos. For example data set 20643 reports 4080 Abies grains in the first sample: none of the other samples have more than 6 Abies grains. And I’m fairly sure that the two counts of 9999 for Corylus/Myrica in data set 16091 are not real. It might be possible to use taxonomic dissimilaries within the data set to identify odd samples but as data sets can span the deglaciation large taxonomic changes are expected anyway.

Expectation 3: Few samples without singletons
“rarity is the attribute of a vast number of species of all classes, in all countries.” Charles Darwin
One of the curious aspects of the chironomid counts from Lake Żabińskie is the lack of rare taxa in many of the samples. I suggested that it is likely that in any census of any species-rich assemblage, the rarest taxa will to be represented by a single individual.
How well does the pollen data conform to this expectation. At 3%, the proportion of samples lacked singletons is higher than I had expected. The samples without singletons are not evenly distributed: 73% of datasets have no samples without singletons; 2% lack singletons in more than 50% of samples.
There is a strong relationship between the proportion of samples in a data set and the number of taxa in the data set.
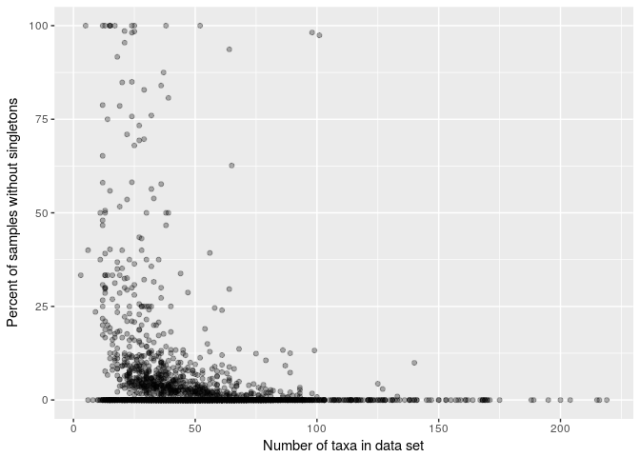
About a fifth of samples in datasets where the number of taxa is 25 or fewer lack singletons. Conversely, only 2.1% of samples from datasets with more taxa lack singletons, and 1.2% of those from datasets with over 40 taxa.
I don’t think this is a caused by low diversity, but is due to a large extent to the limited taxonomic resolution and scope of some of the pollen datasets. In at least the older data, it was common to focus on a limited number of common taxa and to ignore rare species. The lack of singletons is not a useful flag for such data sets.
The almost complete lack of singletons in some species rich data sets is curious and warrants a flag.
Expectation 4: Samples that lack singletons should not have lowest common denominator > 1
It was the many assemblages without singletons were the counts were integer multiples of the rarest taxon, that first alerted me to the problems with the chironomid data from Lake Żabińskie. Such counts should be very rare, but will occur if the counts have been multiplied.
I want to flag samples without singletons where all/most of the counts are integer multiples of the rarest taxon.

Of the 3340 samples without singletons (and taxonomic richness > 5), 300 have all count integer multiples of the rarest taxon. In one sample, all counts are multiples of 43.
In one data set, 99% of values are multiples of 3, the minimum count of all samples.
I have no hesitation in suggesting that in both these examples the data are not the raw counts. Possible scenarios include the data being 1) accumulation rates or concentrations, 2) per mille, 3) back-transformed from percent after rounding, 4) the result of someone pulling a fast one.
Expectation 5. Zeros. Lots of them.
Community data usually have a many zero values and few samples will contain all the taxa found in the whole data set (unless there are very few samples), especially if the richness is high.

Data set 4082 has 56 taxa and 71 samples but only 3% of the counts are zero. Flagged as curious.
Other testable expectations?
Suggestions for other tests that could reveal errors or other problems in putative count data would be very welcome. I’m hoping that, in collaboration with Simon Goring, some of these tests can be implemented in Neotoma and that the clearly erroneous data sets can be cleaned.
 @richardjtelford

Pingback: Pollen Spikes | Musings on Quantitative Palaeoecology